Pakistan's Stock Market Is Not A Stock Market
Eight phases. Four crashes. One pattern.

Pakistan's stock market is not really a stock market. It is a macro cycle that occasionally rents the stock market.
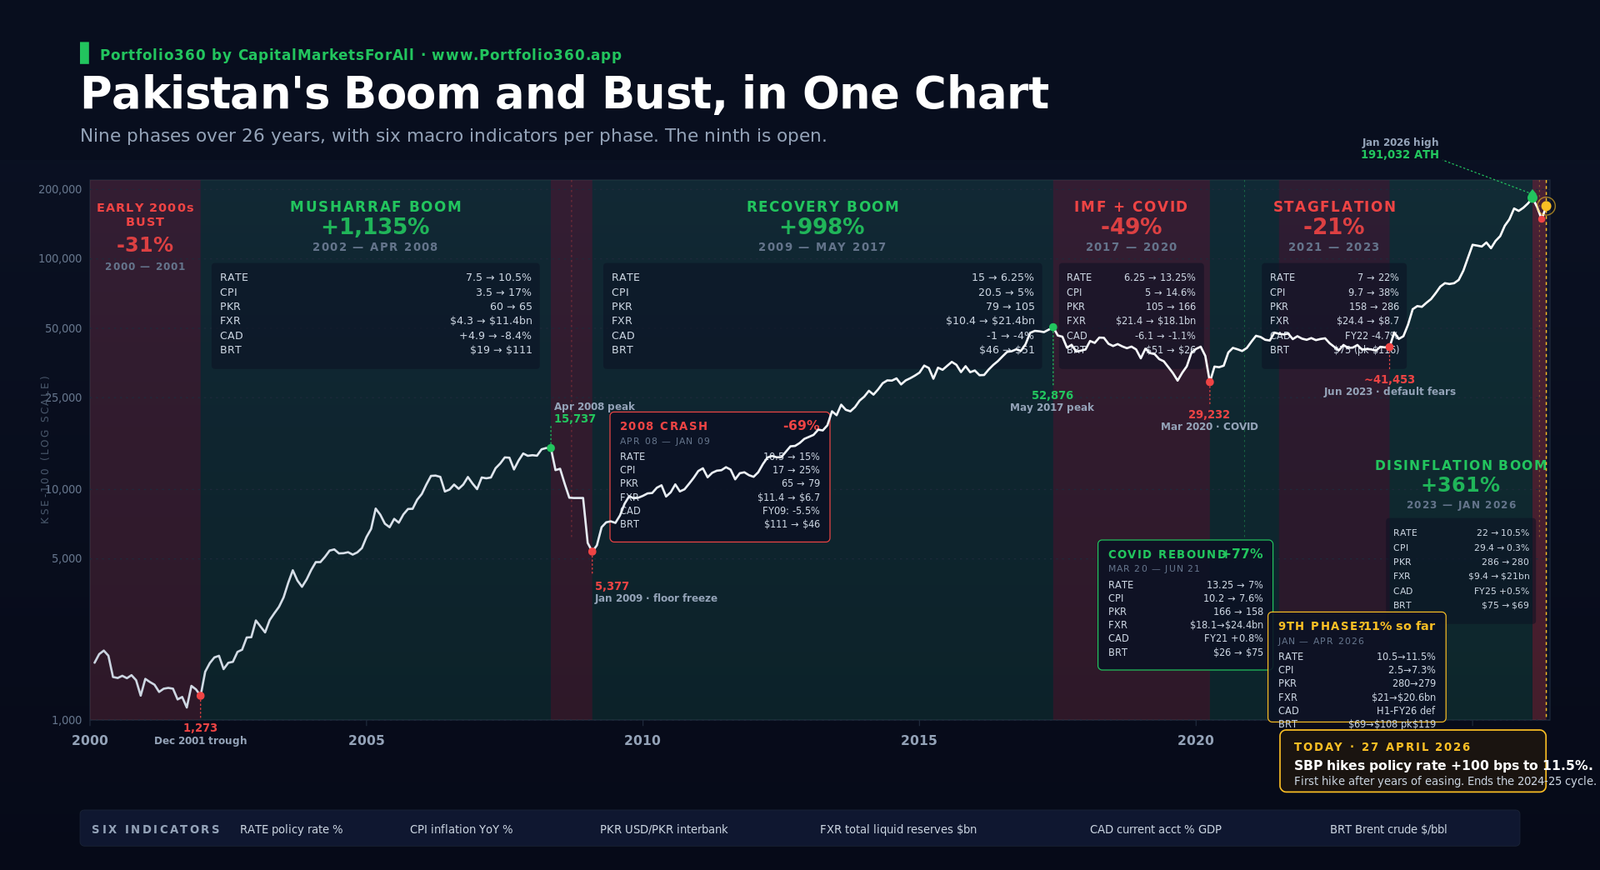
That sounds like a paradox. The chart below is the evidence. When you put 26 years of the KSE-100 on a single page and shade the booms and busts, what you see is not a market evolving with the fortunes of its companies. You see a country going through repeating macro phases, and the index responding in lockstep.
Eight phases have already played out. Four booms. Four busts. Each was triggered by the same handful of macro forces moving in the same recognisable order. Each ended on a signal that those forces flagged early, if you knew what to watch.
A ninth phase may be starting right now. The KSE-100 has fallen from its all-time high of 191,032 hit in January 2026, dropped 23 percent into a March low, and recovered roughly halfway. Today, 27 April 2026, the State Bank of Pakistan raised the policy rate by 100 basis points to 11.5 percent, the first hike after almost two years of cutting. What the prior eight phases say about the ninth is what this piece is built to answer.
Let me walk you through the shape of the cycle, the dashboard of indicators that turn it, the rupee delusion that hides in every Pakistani equity boom, why the latest cycle was different from the ones before, and the playbook a retail investor in Pakistan can actually use to read this market for what it is.
The Shape of The Cycle
Look at the chart for thirty seconds before you read on. Notice the rhythm. Green band, then red. Green, then red. The four pairings repeat with such regularity that you can almost set a metronome to them.
Cycle 1, 2000 to 2009. The cycle opens in a bust. From early 2000 to December 2001, the KSE-100 fell roughly 31 percent, from above 1,800 to under 1,300, against a backdrop of post-nuclear-test sanctions, the September 2001 shock, and a country re-entering an IMF programme. That trough became the launch pad for what is still the largest boom in PSX history. From below 1,300 the Musharraf-era rally took the index to nearly 16,000 by April 2008, a gain of more than 1,100 percent in six years.
The 2008 crash then took it back below 5,000 in nine months, a 69 percent collapse.
Cycle 2, 2009 to 2020. The civilian-era recovery lifted the index from below 5,000 to almost 53,000 by May 2017, another gain of nearly 1,000 percent. The rally rode an IMF stabilisation programme, the CPEC announcement, deferred-payment oil from a friendly country, and a global liquidity backdrop that pulled foreign flows into emerging markets. The bust that followed was longer and more grinding.
The IMF tightening cycle from 2018 onward, the rupee devaluations of 2018 and 2019, and the COVID shock of March 2020 together took the index down close to 50 percent at the trough.
Cycle 3, 2020 to 2023. A short post-COVID rebound lifted the index from 27,000 to 48,000 in fifteen months, a gain of about 78 percent.
Then stagflation set in. From mid-2021 to mid-2023 the index drifted sideways and lost about 21 percent in nominal terms, but the rupee was halving against the dollar in the same window, so the dollar-adjusted loss was much steeper. The cycle bottomed in June 2023 with reserves around four billion dollars and the country one IMF tranche away from default.
Cycle 4, 2023 to 2026. From the June 2023 trough below 41,000, the index climbed to 191,032 by January 2026, a gain of more than 360 percent in two and a half years.
What has happened since is the phase we are still living through.
That is the shape. Booms run between two and eight years and deliver returns of several hundred to over a thousand percent. Busts run between nine months and three years and shed between twenty and seventy percent. Each pairing is structurally similar even though the trigger that ended it was different. Each begins where the last one ended.
Are we heading into a ninth phase, or is the move since January a correction inside the eighth? From the January 2026 peak of 191,032, the index fell 23 percent to a March low of 148,743, and has since recovered partway on a $5 billion package and de-escalation around the Strait of Hormuz. We do not yet know whether we are watching the start of a new bust or a pause inside the existing rally. That is the question this piece is built to answer. The prior eight phases are how we are going to read it, starting with the dashboard of indicators that turn each cycle.
The Dashboard of Indicators That Turn Each Cycle
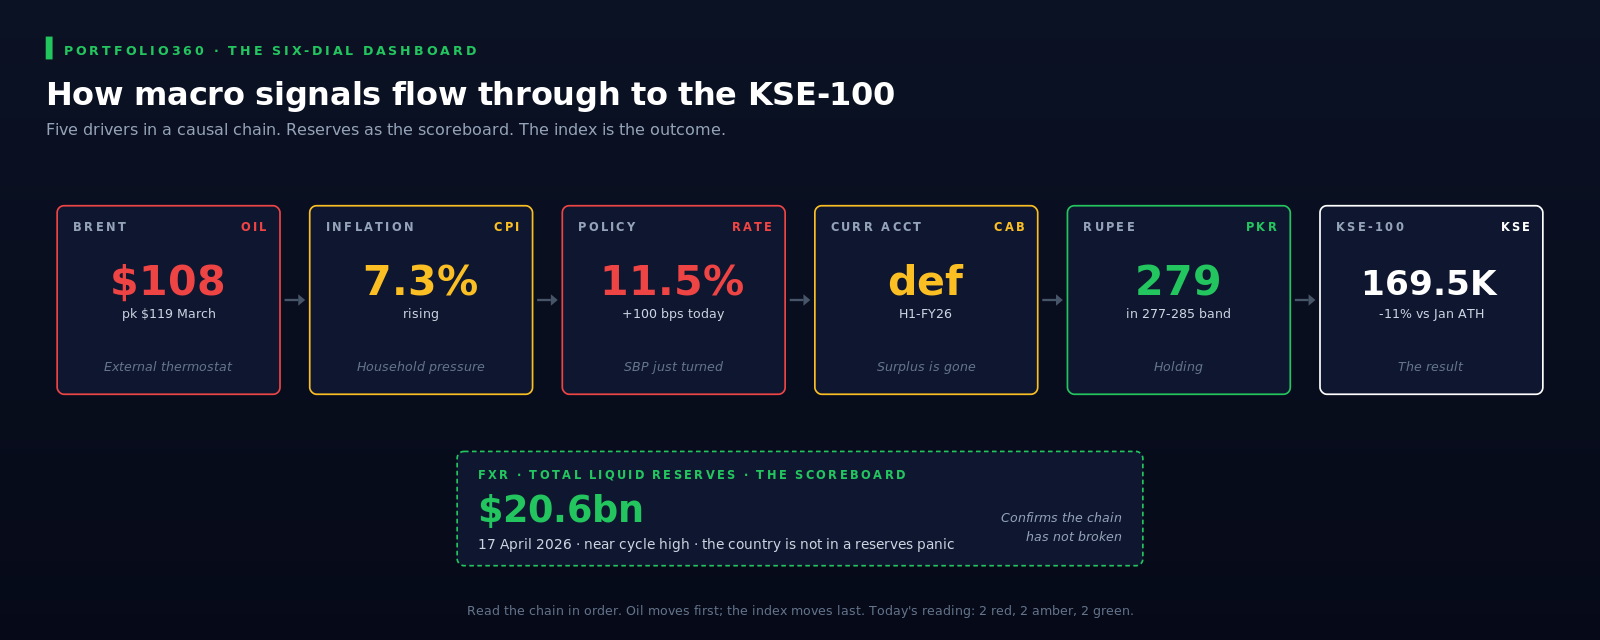
Pakistan's equity cycles look mysterious only if you watch the index alone. Watch six other dials and the cycle becomes legible. Five of them you have seen before, in the previous piece on the indicators that called the 2026 correction in advance. The sixth, foreign exchange reserves, we are adding here because any conversation in a chai dhaba about "the economy" inevitably turns to one number, and that number is reserves.
The six dials work as a chain. Crude oil moves first. Inflation responds. The State Bank reacts. The current account shifts. The rupee comes under pressure. Reserves drain. And the KSE-100 follows. None of the dials moves cleanly on its own. Each one nudges the next.
Brent crude. Pakistan imports almost everything it burns, so Brent is the country's external thermostat. Below $80 the country breathes. Above $100 the macro starts heating up. Most busts on our chart had a Brent stress event in their DNA: $147 in July 2008, $130 after Russia-Ukraine in 2022, and $119 twice in March 2026 when the Strait of Hormuz started its war ping-pong. Brent is still above $108 today. The oil dial is red.
Inflation. CPI is what oil and the rupee print on a household budget. Inflation peaks are the most counter-intuitive signal on this dashboard. They almost always coincide with the bottom of the equity bust, not the top. CPI peaked at 25 percent in August 2008, at 14.6 percent in January 2020, and at 38 percent in May 2023, the all-time high in this country's modern record. Each peak was followed by the next boom. The cycle low arrived in April 2025 at 0.3 percent, the lowest reading in six decades. Today CPI is back at 7.3 percent and rising. The dial is no longer green.
SBP policy rate. The State Bank's main lever, and the most important market signal of the six. The rate peak has marked the equity bottom in every prior bust: 15 percent in early 2009, 13.25 percent in 2020, 22 percent in 2023. Today the rate has turned the other way for the first time in two years. The hike is not necessarily the start of a multi-year bust, but it is the end of the easing tailwind that powered Cycle 4.
Current account balance. What the country earns versus what it spends abroad. Deepening deficits flag busts. Narrowing deficits signal recovery. Surpluses are rare. FY08 ran an 8.4 percent deficit before Bust 1. FY18 ran 6.1 percent before Bust 2. FY22 ran 4.7 percent inside Bust 3. The most striking number on this dial in our chart is FY25, which printed a 0.5 percent surplus, Pakistan's first annual surplus in 14 years. That surplus arrived at the top of the rally. A once-in-a-generation surplus printing at the same moment as the index hits an all-time high is the kind of coincidence a careful investor should pause on.
The rupee. PKR per USD is the market's verdict on Pakistan's macros, delivered daily. It does not turn cleanly with the cycle. It moves in stages. The big devaluations came in late 2008 (60 to 80), 2018 to 2019 (105 to 162), and 2022 to 2023 (175 to 286). Each devaluation episode coincided with a bust. What is unusual about Cycle 4 is that the rupee has held in a 277 to 285 band for almost two years, anchored by IMF discipline and a stronger external account. The current ninth-phase question has not yet broken that band. If the rupee stays disciplined, the bust is structurally limited. If it breaks, the bust deepens.
Foreign exchange reserves. Total Liquid Reserves are the scoreboard at the bottom of every Pakistani bust. October 2008, $6.7 billion. June 2019, around $14 billion. February 2023, $8.7 billion, with SBP-only at $2.92 billion, the number everyone in the country remembers. Each of those troughs marked the cycle bottom within weeks, and each recovery began only when an external anchor arrived, an IMF programme, a friendly-country deposit, or both. Today the dial reads $20.6 billion as of 17 April 2026, near the cycle high. The country is not in a reserves panic. That is the single most important difference between today and the bottoms of 2008, 2019, and 2023.
Read together, the dashboard says the macro tailwind that powered Cycle 4 is gone, but the structural conditions for a 2008 or 2023-style collapse are not yet in place. Two dials have turned red, the policy rate as of today and oil since March, but the oil signal is a war shock rather than a structural break. Inflation is amber and rising. The current account surplus has almost gone. The rupee is holding. Reserves are at a cycle high. That mix is what makes the ninth-phase question genuinely open. Before we use the dashboard to answer it, the next section deals with the one number that hides inside every Pakistani equity boom: how much of the gain is real once the rupee has its say.
The Rupee Delusion
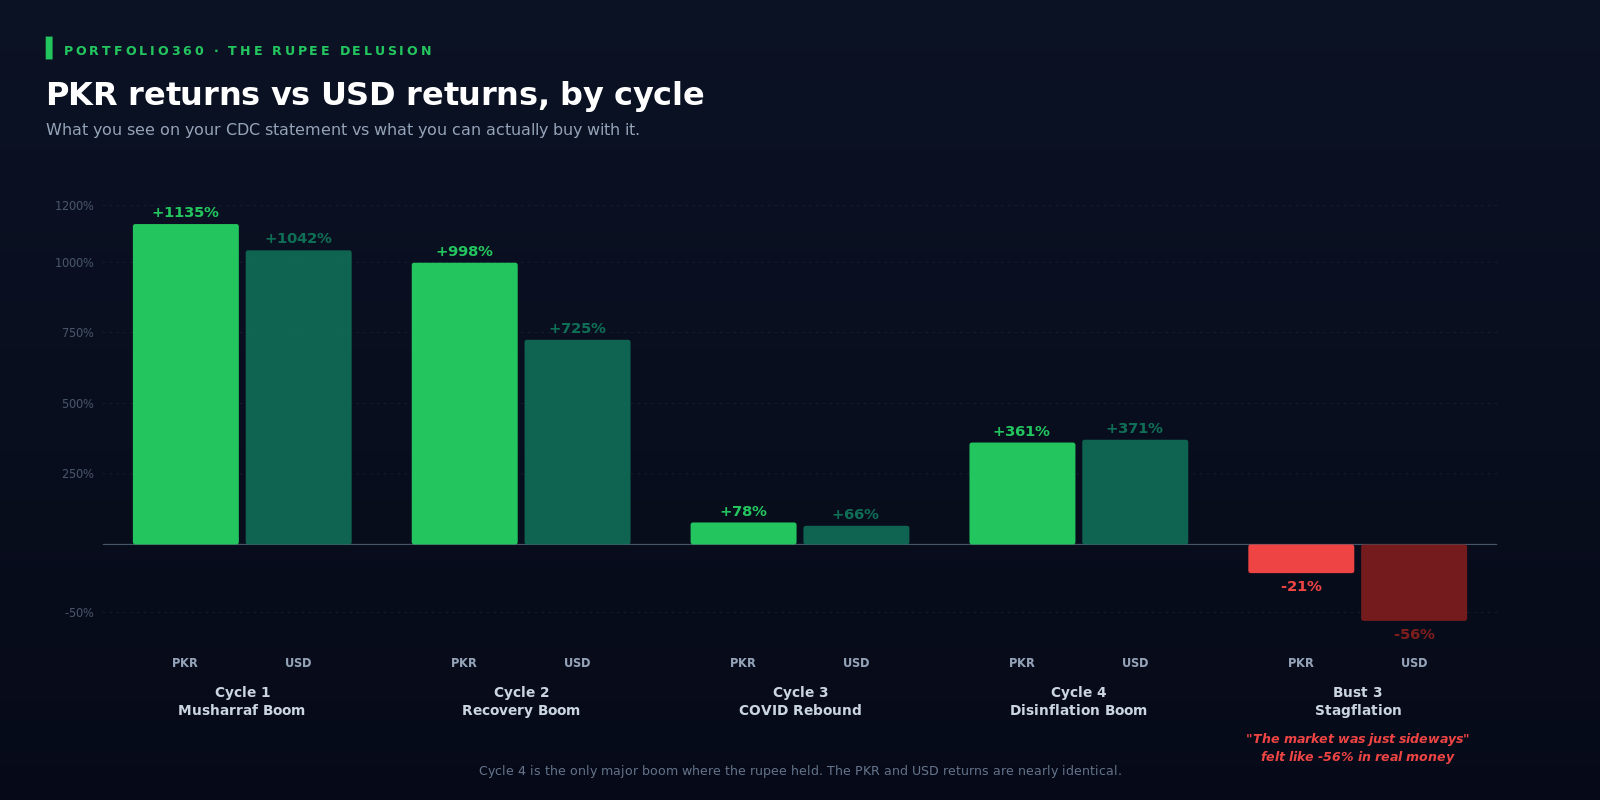
Look at the chart again. The KSE-100 went from below 1,800 in January 2000 to a peak of 191,032 in January 2026. A gain of nearly 10,700 percent over 26 years, almost 108 times your money. Spectacular.
It is also misleading. In the same window, the rupee went from 52 to the US dollar to 279. The dollar became 5.4 times more expensive. The same KSE-100 holding measured in dollars went from $34 per index unit to $682. A return of 20 times, or +1,900 percent.
Both numbers are correct. Both describe the same investment. The 108x is what you tell yourself when you look at your CDC statement. The 20x is what you actually have when you need to pay for anything priced in dollars: fuel, an iPhone, your child's tuition abroad, a foreign holiday, imported medicines. The PKR figure is more than five times the USD figure, and the difference is rupee devaluation, not value creation.
The most painful version of this gap shows up inside the busts. Bust 3, the stagflation phase from 2021 to 2023, looks like a 21 percent decline on the chart. In USD terms it was over 50 percent, because the rupee halved against the dollar in the same window. A Pakistani investor who held through Bust 3 told themselves "the market is just sideways". In real money, they lost more than half their wealth. Rs 1 crore invested at the June 2021 peak was Rs 87.5 lakh on the screen by June 2023, but only about Rs 48 lakh in dollar-equivalent purchasing power.
Cycle 4 is the rare exception. From October 2023 to January 2026, the rupee held in a 277 to 286 band, anchored by IMF discipline. The KSE's 361 percent gain in PKR was 371 percent in USD. Cycle 4 was, by Pakistani standards, a real boom in real money.
That is why the rupee paragraph on the dashboard matters more than any other indicator. As long as the 277 to 285 band holds, the ninth-phase bust stays nominal and limited. If the band breaks, the bust we see on the screen will be much smaller than the one we feel in our spending.
Why Cycle 4 Was Different
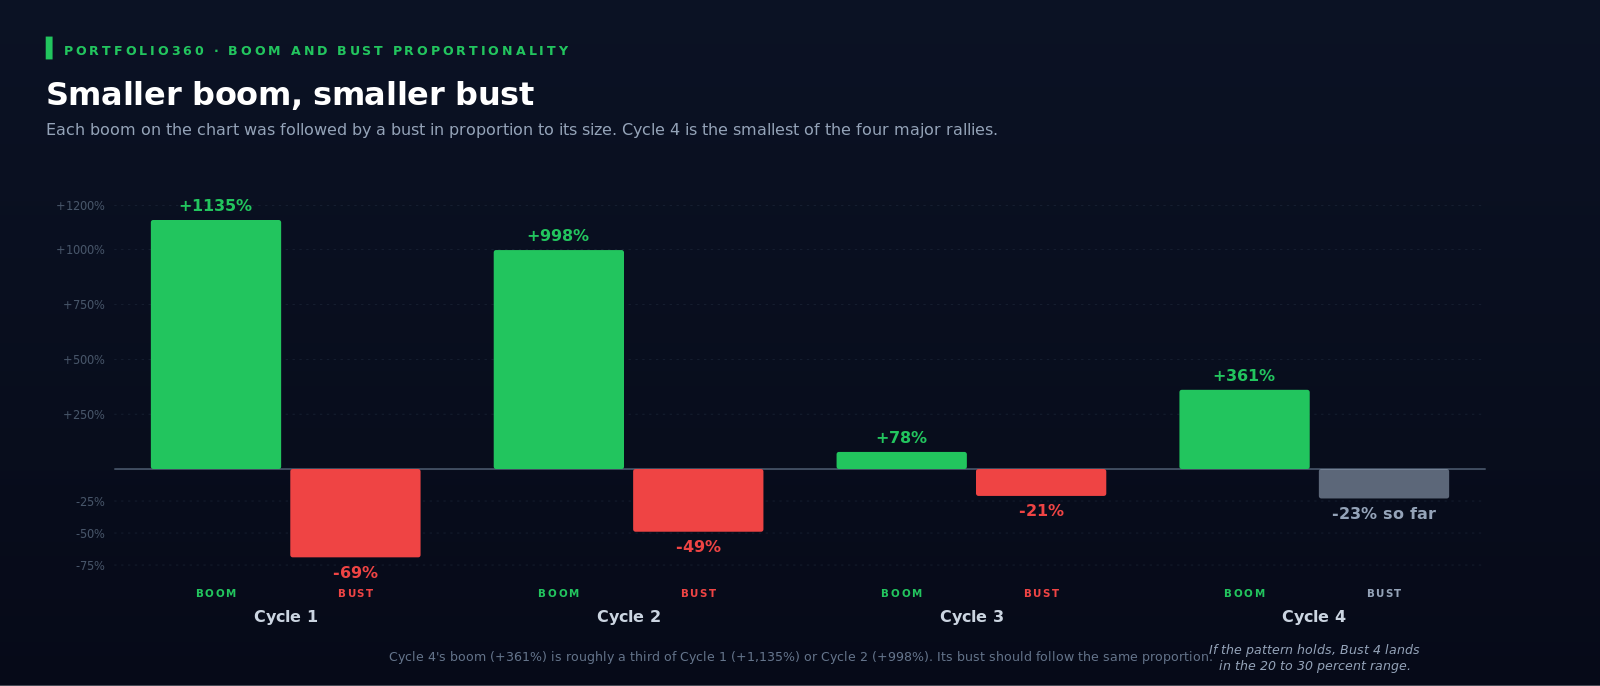
Cycle 4's rally from 41,453 in June 2023 to 191,032 in January 2026 was a gain of 361 percent over two and a half years. A great rally by any global standard. By Pakistani standards, the smallest of the four major booms on our chart. Cycle 1 returned 1,135 percent. Cycle 2 returned 998 percent. Cycle 4 returned roughly a third of either.
The reason matters. Cycles 1 and 2 were classic bull markets, the kind where investors keep paying higher and higher prices for every rupee of company earnings until valuations stretch well beyond historical norms. Cycle 4 started from a different place. The June 2023 trough was a default-pricing event. The KSE-100 was trading below book value, with the country one IMF tranche away from missing an external payment. The rally that followed was less about companies getting better and more about the country-pricing being repaired, the index moving from "Pakistan may default" back to "Pakistan is normal". Even at its January 2026 peak, valuations were less stretched than at the peaks of prior major booms, because most of Cycle 4's gain was the unwinding of crisis-pricing rather than the market paying ever-higher premiums.
This matters for the question we left open at the start, whether what is happening since January is a new ninth phase or a correction inside the existing rally. Bigger booms have produced bigger busts on this chart. +1,135 then -69. +998 then -49. +78 then -21. Smaller boom, smaller bust. Cycle 4's +361 percent boom was the smallest of the four major rallies. If Pakistani equity history is any guide, Bust 4 should land in the range of 20 to 30 percent peak-to-trough.
That range is already inside what we have seen. The peak-to-trough drawdown from January's 191,032 to March's 148,743 was 23 percent. The market has since recovered partway on a $5 billion package from a friendly country and Hormuz de-escalation. If proportionality holds, the trough may already be in.
Let me now walk you through what a retail investor in Pakistan can actually do with all of this.
The Retail Playbook
Three things come out of 26 years on this chart that a Pakistani retail investor can act on.
Watch the dashboard, not the index. The dials turn first, the index follows. Inflation peaked in May 2023 weeks before Cycle 4's boom began. Reserves bottomed at $8.7 billion in February 2023, four months before the index bottomed in June. Read the dials and you see the cycle turn early.
Wait for the last hike, not the first. Today's pivot from cutting to hiking is the end of an easing tailwind, not necessarily the start of a multi-year tightening cycle. It may be one-and-done if oil eases and the war pause holds. Until we know, treat the rate cycle as neutral, not friendly. You can add patiently now, but save the heavier commitments for when the next rate move is a cut.
Position by where you stand. If you are holding Cycle 4 gains through a 10 to 15 percent drawdown, the proportionality argument suggests the trough may already be in. Panic-selling into a bust that has likely done most of its work is the most expensive mistake. If you are in cash waiting for an entry, the cleanest signal is not the next five percent lower on the index but the dashboard turning back to green, especially the rate, inflation, and reserves dials. You can buy earlier, but the easy money was made in Cycle 4. Gains from here will be smaller because the easing tailwind is gone.
The cycle does not finish where this piece ends. Each month's read on the six dials and what they say about the ninth phase goes up at www.portfolio360.app/journal.
The country, not the companies, is the trade.
Closing
Twenty-six years. Eight phases. Four crashes. One pattern. The ninth phase is still being written. Today the rate cycle has turned, oil is heating up, the rupee is holding, reserves are at a cycle high. Whether what comes next is a bust or a pause inside Cycle 4, you will know it from the dashboard before you know it from the index. Pakistan's stock market is not really a stock market. Read the cycle and the index reads itself.
Disclaimer: This blog is published by Portfolio360 Journal for educational purposes only. It does not constitute investment advice, a recommendation, or an offer to buy or sell any security. Readers should conduct their own research or consult a licensed financial advisor before making any investment decision.
 MarketsThe Bank Quarter Started To Matter
 MarketsThe Bear Stood Up
 MarketsThe Bear Got Shallower, Not Dead